

| |

")
")
")
| Name | CEOP CAMP Chao Phraya River Reference Site |
| Metadata Identifier | CEOP_CAMP_Chao_Phraya_River20230727055944-DIAS20221121113753-en |
| Name | Masatoshi AOKI |
|---|---|
| Organization | Tokyo University of Agriculture and Technology |
| Address | 3-8-1 Harumi-cho , Fucuu-city, Tokyo, 183-8538 , Japan |
| TEL | +81-42-367-5727 |
| FAX | +81-42-367-6078 |
| aoki.mas@cc.tuat.ac.jp |
| Name | DIAS Office |
|---|---|
| Organization | Japan Agency for Marine-Earth Science and Technology |
| Address | 3173-25, Showa-Cho, Kanazawa-ku, Yokohama-shi, Kanagawa, 236-0001, Japan |
| dias-office@diasjp.net |
| Name | Masatoshi AOKI |
|---|---|
| Organization | Tokyo University of Agriculture and Technology |
| aoki.mas@cc.tuat.ac.jp |
| Name | Masatoshi AOKI |
|---|---|
| Organization | Tokyo University of Agriculture and Technology |
| aoki.mas@cc.tuat.ac.jp |
creation : 2010-05-06
To clarify the energy and water cycle in the Thailand, it is important to understand the characteristics of the basic meteorological elements and surface fluxes.
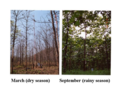
The purpose of PBL-Tower (Planetary Boundary Layer -Tower) observation is to monitor these meteorological values and analysis the mechanisms of the energy and water cycle in the Teak Forest in tropical Monsoon areas.
climatologyMeteorologyAtmosphere
| Begin Date | 2002-10-01 00:00:00 |
| End Date | 2004-12-31 23:59:59 |
| Temporal Characteristics | Hourly |
| North bound latitude | 18.40 |
| West bound longitude | 99.47 |
| Eastbound longitude | 99.47 |
| South bound latitude | 18.40 |
| Keyword Type | Keyword | Keyword thesaurus Name |
|---|---|---|
| theme | Climate, Water | GEOSS |
| Keyword Type | Keyword | Keyword thesaurus Name |
|---|---|---|
| theme | DIAS > Data Integration and Analysis System | No_Dictionary |
| name | version | specification |
|---|---|---|
| PRN | no information | CEOP Unified Format |
Station Pressure is measured using a capacitive absolute pressure sensor, a kind of aneroid type barometer. When the pressure changes, the silicon diaphragm bend and changes the height of the vacuum gap in the sensor. This changes the capacitance of the sensor, which is measured and converted into a pressure reading.
Air temperature is measured using a Pt100 resistance thermometer.
Relative humidity is measured using a thin-film polymer sensor. The thin polymer film either absorbs or releases water vapor as the relative humidity of the ambient air rises or drops. The dielectric properties of the polymer film depend on the amount of water contained in it: as the relative humidity changes the dielectric properties of the film change and so the capacitance of the sensor changes. The electronics of the instrument measure the capacitance of the sensor and convert it into a humidity reading.
Wind speed and direction is measured using a 3-cup anemometer.
Precipitation is measured by a tipping bucket rain gauge.
(Note: Old first-half Precipitation was averaged by post one hour. To be consistent with other observed data, we applied previous one hour average.)
Shortwave radiation is measured using a pyranometer. The sensing element consists of a wire-wound thermopile constructed of electroplated copper on constantan, covered with black paint that has a spectrally flat absorption response. It is protected from environment effects (wind, etc.) using two concentric glass dome covers. Thermopiles detect the increase in temperature caused by the absorption of heat from solar radiation.
(Note: As there were noise upward and downward shortwave radiation in the night-time, the data under 5 W/m2 was replaced in the value 0.00 and flagged I. (G is flagged to the original 0 W/m2 data.))
Longwave radiation beyond 3 micrometer is measured using a pyradiometer. The principal of sensor is the same as pyranometer. It uses a specially coated silicon dome that transmits incoming radiation with wavelength of more than 3 micrometer by cutting off shorter wavelengths.
Skin Temperature is measured by radiation thermometer.
And the Four parameters indicated below are computed by using “CEOP Derived Parameter Equations: http://www.joss.ucar.edu/ghp/ceopdm/refdata_report/eqns.html”. Also put the data flag “I”,
Dew Point Temperature is computed by using (Bolton 1980):
es = 6.112 * exp((17.67 * T)/(T + 243.5));
e = es * (RH/100.0);
Td = log(e/6.112)*243.5/(17.67-log(e/6.112));
where:
T = temperature in deg C;
es = saturation vapor pressure in mb;
e = vapor pressure in mb;
RH = Relative Humidity in percent;
Td = dew point in deg C
Specific Humidity is computed by using (Bolton 1980):
e = 6.112*exp((17.67*Td)/(Td + 243.5));
q = (0.622 * e)/(p - (0.378 * e));
where:
e = vapor pressure in mb;
Td = dew point in deg C;
p = surface pressure in mb;
q = specific humidity in kg/kg.
U,V Components are computed by using (GEMPAK):
U = -sin(direction) * wind_speed;
V = -cos(direction) * wind_speed;
NET radiation (GEMPAK):
NET_radiation = down (in) short + down (in) long - up (out) short - up (out) long;
For all parameters, the data has been visually checked, looking for extremely and unusual low/high values and/or periods with constant values thorough the CAMP Quality Control Web Interface.
The quality control flags follow the CEOP data flag definition document.
1. No financial implications are involved for the CEOP reference site data exchange.
2. Commercial use and exploitation of CEOP reference site data is prohibited.
3. Any re-export or transfer of the original data received from the CDA archive to a third party is prohibited.
4. The origin of CEOP reference site data being used for publication of scientific results must be acknowledged and referenced in the publication.
5. CEOP reference site data users are strongly encouraged to establish direct contact with data providers for complete interpretation and analysis of data for publication purposes.
6. Co-authorship of data users and CEOP reference site Principle Investigators on papers making extensive use of CEOP data is justifiable and highly recommended.
see http://www.eol.ucar.edu/projects/ceop/dm/documents/ceop_policy.html
If data provider does not have data policy, DIAS Terms of Service (https://diasjp.net/en/terms/) and DIAS Privacy Policy (https://diasjp.net/en/privacy/) apply.
If there is a conflict between DIAS Terms of Service and data provider's policy, the data provider's policy shall prevail.
A minimum requirement is to reference CEOP as:
The in-situ data is provided under the framework of the "Coordinated Energy and Water Cycle Observations Project (CEOP)."
for the Coordinated Energy and Water Cycle Observations Project data (2005), and as:
The satellite data is provided under the framework of the "Coordinated Enhanced Observing Period (CEOP)."
for the Coordinated Enhanced Observing Period data (2001 - 2004).
If you plan to use this dataset for a conference presentation, paper, journal article, or report etc., please include acknowledgments referred to following examples. If the data provider describes examples of acknowledgments, include them as well.
" In this study, [Name of Dataset] provided by [Name of Data Provider] was utilized. This dataset was also collected and provided under the Data Integration and Analysis System (DIAS), which was developed and operated by a project supported by the Ministry of Education, Culture, Sports, Science and Technology. "